
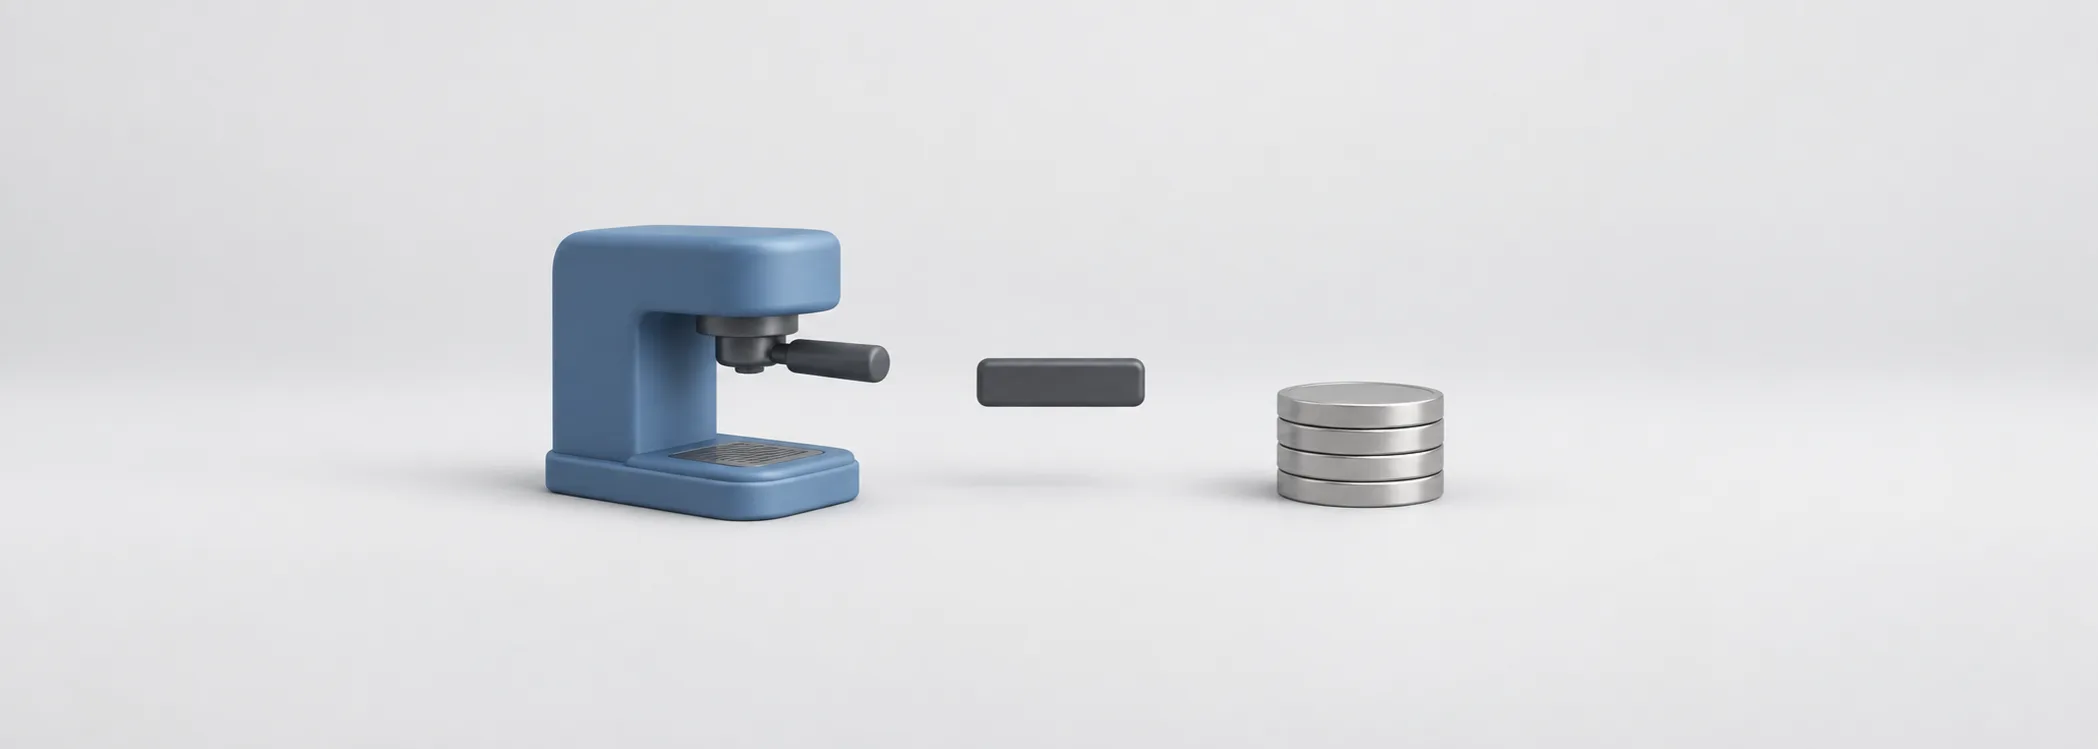
Harbor Coffee, our fictional coffee brand, brings in $180 million of operating cash in FY3 and spends $60 million on long-lived assets. What remains after that spending?
Subtract the two: $120 million. This is its free cash flow. The name sounds like money owners can take home. Before you treat it that way, you need to know what the subtraction leaves out.
The cash left after capital spending
Free cash flow (FCF) here means operating cash flow, or OCF, minus all cash capital expenditure. Use the cash capex from the investing section you just read.
Harbor's FY3 result is $180 million − $60 million = $120 million. Cash interest and taxes are already included in its OCF; subtracting them again would count them twice.
Use $60 million as the amount spent, even if the statement shows −$60 million. Subtracting a negative would add the spending back. Use all the cash capex lines, not the whole investing total, which can include securities trades and acquisitions.
FCF is a non-GAAP measure: US accounting rules do not define it as a standard subtotal. The SEC notes that definitions vary. Check the recipe before comparing an app's FCF with a company's “adjusted FCF.”
Put the cash on a useful scale
Harbor's accounts supply OCF and capex; FCF is the difference. All amounts are USD millions.
| Year | OCF | Capex | FCF |
|---|---|---|---|
| FY1 | 161 | 55 | 106 |
| FY2 | 170.5 | 58 | 112.5 |
| FY3 | 180 | 60 | 120 |
Two ratios put that cash in context. Use the same year and whole-company figures throughout:
- FCF margin scales cash to sales, like profit margins: FCF ÷ revenue × 100. Harbor's FY3 revenue is $1,100 million, so $120 million ÷ $1,100 million × 100 ≈ 10.91%. About $10.91 remains per $100 of sales after capex.
- Earnings conversion here compares FCF with net income: FCF ÷ net income × 100. Harbor's FY3 net income is $150 million, so $120 million ÷ $150 million × 100 = 80%. That is $0.80 of FCF per $1 of profit.
Harbor's $30 million gap between profit and FCF has two parts: its $60 million capex exceeds $40 million depreciation by $20 million, and changes in operating balances absorb another $10 million. The ratio measures the gap; the accounts explain it.
Optional FY1–FY3 check: total FCF of $338.5 million ÷ total net income of $427.5 million × 100 ≈ 79.18%. Those earnings are $135 million + $142.5 million + $150 million. Add first; do not average annual percentages.
High and low depend on spending
There is no universal good FCF margin or conversion rate. Compare several years using the same definition, then businesses with similar spending needs. Negative FCF can come from expansion or weak operations. The cause matters more than the sign.
Maintenance capex sustains existing capacity; growth capex expands it. Harbor's FY3 spending memo estimates $40 million of maintenance and $20 million of growth within its $60 million total. Real accounts may not separate them: replacing equipment with something bigger can serve both purposes.
Harbor's $40 million depreciation happens to equal its maintenance estimate. That is no shortcut for other companies. Depreciation spreads past asset costs over time; it does not price tomorrow's replacements.
Suppose Harbor defers the $20 million growth spending while OCF stays fixed at $180 million. FCF becomes $180 million − $40 million = $140 million. The larger FCF portion comes entirely from spending less.
The extra $20 million comes without another sale. Delaying expansion could also cost future business. A larger cash number can hide a smaller investment in the future.
Use it as a check, not a verdict
FCF tests profit against customer collections, operating payments and capital spending. But a cash measure can flatter too:
- Payment timing. Collecting customer money sooner or paying suppliers later lifts OCF for the period. If a supplier agrees to payment just after year-end instead of just before it, this year's cash improves without another sale. The bill still comes due.
- Postponed investment. Delaying needed equipment spending lifts FCF. It leaves the equipment need unresolved.
- Noncash compensation. The bridge from profit to OCF adds back noncash stock-based compensation, or SBC: employee pay in equity awards. Paying people in shares still costs owners something.
These are reasons to read further, not proof of misconduct.
For Tessel Software, our fictional subscription business, the gap is much wider: FY3 OCF of $445 million less $50 million capex gives $395 million of FCF against just $45 million of profit. Its OCF bridge includes a $250 million SBC addback and $120 million from operating working-capital changes, chiefly customer prepayments. Those customers have paid, but Tessel still owes them service.
Repaying debt principal returns borrowed money, a financing payment outside this subtotal. Acquisitions, other obligations and owner distributions also draw on cash. Positive FCF is no promise of a shareholder payout.
Try the subtraction in Apple's filing
Continue with the two inputs from printed page 33 of Apple's FY2024 annual report. They cover the year ended September 28, 2024, in USD millions:
Cash generated by operating activities: 118,254.
Payments for acquisition of property, plant and equipment: (9,447).
The parentheses mark spending. Subtract that amount from operating cash before reading on.
You get $118,254 million − $9,447 million = $108,807 million. This is our calculation of operating cash less property, plant and equipment spending, not an FCF total or forecast reported by Apple.
Those two rows cannot tell you whether the spending was enough to sustain the business. When you read EBITDA and adjusted earnings, the same question helps: which costs sit outside the headline?
In short
- Free cash flow here is operating cash flow minus all cash capex.
- Margin measures cash left per sales dollar; conversion measures it per dollar of profit.
- Compare several years: spending and payment timing can flatter a single year's FCF.
- Postponing investment or paying staff in shares does not make the cost disappear.
- Positive FCF is useful evidence, not cash promised to shareholders.